Reporting Policy
Demand Gen Platform-Comparable Conversions
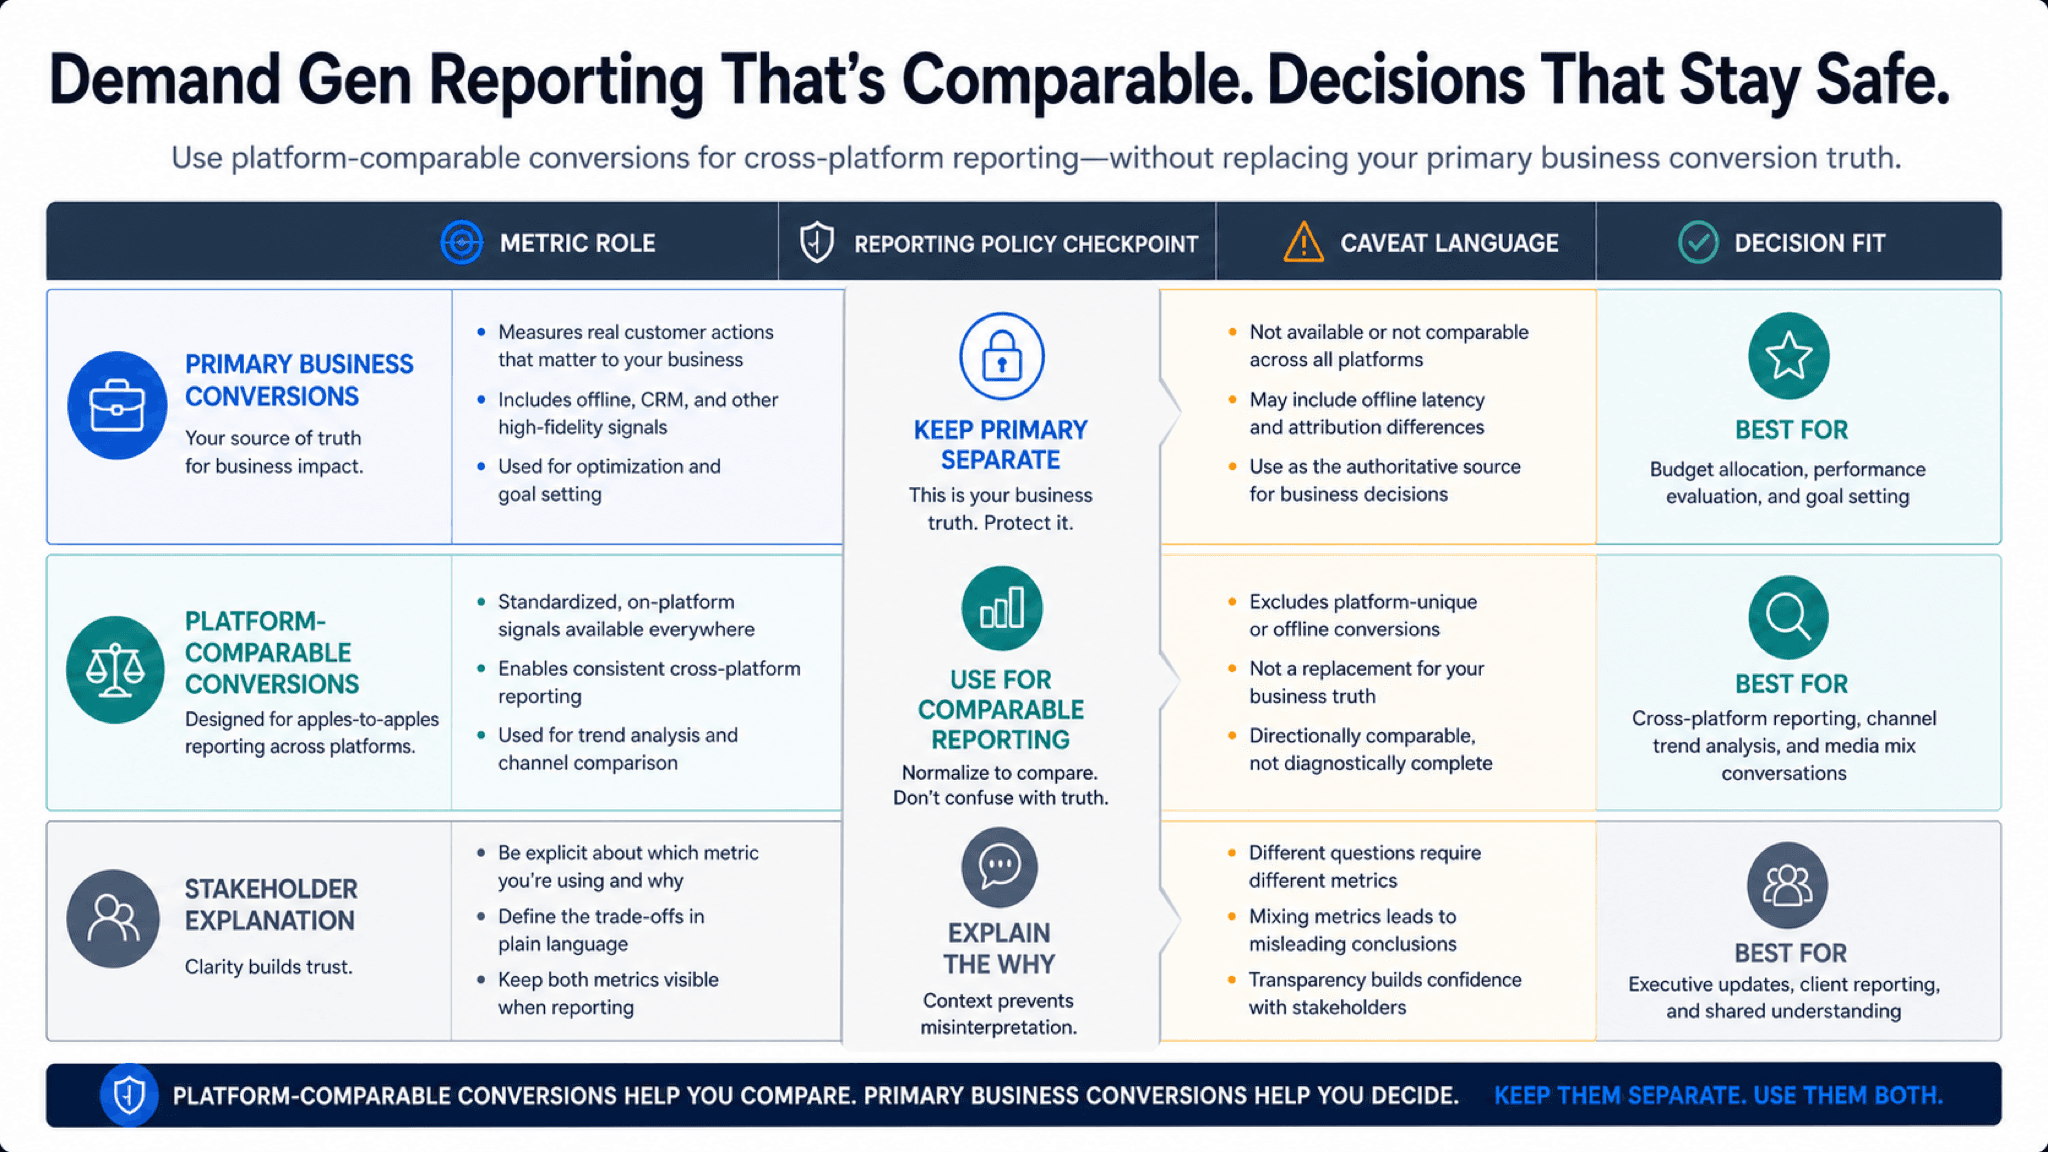
Illustrative concept graphic for cross-platform reporting comparisons, not a product screenshot.
Cross-platform Demand Gen comparisons fail on blended averages. Compare the proof each platform allows, starting with platform-comparable conversions and their caveats.
Key takeaway
The client deck lines up Demand Gen CPA next to a social platform CPA and someone declares a winner before anyone asks what each number counts. Google's conversions (Platform Comparable) column exists so Demand Gen can be compared more fairly to other advertising platforms by isolating Demand Gen touchpoints and including view-through conversions in the reporting view. It does not replace primary conversions for bidding. It is a reporting lens with explicit boundaries.
Google's platform-comparable documentation says the column is reporting only, does not affect optimization, and should not be used to compare Demand Gen with Search, Performance Max, or Display inside Google Ads. Fair cross-platform work matches conversion events, attribution windows, budget structure, and creative setup, then states which metric answers which stakeholder question. Parallel AI reads the connected account, separates primary and platform-comparable views in a doc or spreadsheet, and drafts reporting notes for a person to approve before numbers leave the account.
Checked against current product, pricing, trust, and official Google materials so the comparison, buying guidance, and fit criteria stay current and defensible.
- Google's platform-comparable Help page defines the isolation rules, view-through inclusion, and reporting-only scope.
- The same page lists related columns such as Cost / conv. (Platform Comparable) and Conv. value / cost (Platform Comparable).
- Parallel's role stays limited to metric-role documentation, finished stakeholder notes, and drafted changes held for human approval.
Cross-channel meetings love one slide with four CPAs and a winner circled in red. Each platform counted conversions differently before the meeting started. Demand Gen primary conversions use Google's normal attribution models and exclude view-through conversions from default reporting. Platform-comparable conversions adjust the view so Demand Gen can be compared more fairly to off-Google platforms. Neither column is a universal truth. Each is proof under stated rules.
DEFINITION
Conversions (Platform Comparable)
A Google Ads reporting column for Demand Gen that limits attribution to Demand Gen touchpoints in isolation from other Google campaigns and includes view-through conversions in the reporting view. Google's documentation states the column integrates with existing reporting views, does not impact optimization and bidding, and populates for Demand Gen campaigns at campaign, ad group, ad, and ad-level asset reporting.
Google Ads Help: About platform-comparable conversions
The reframe is proof comparison, not average comparison. CPMs and CPCs tell you what attention cost. Conversions tell you what counted. Platform-comparable conversions tell you what counted under a cross-platform lens Google documented for Demand Gen versus other advertising platforms. Primary conversions tell you what counted for bidding inside Google Ads. Finance needs both roles labeled before anyone reallocates budget.
Google's documentation is explicit about limits: do not use platform-comparable columns to compare Demand Gen with other Google Ads products such as Search or Performance Max. Historical data may not exist before the column launched in the account. AWCT web conversions are supported; GA4 and Floodlight may show primary column behavior instead. Those boundaries belong in the deck footnote, not in a verbal caveat after the client nods.
Related columns should travel together in exports. Cost / conv. (Platform Comparable), Conv. rate (Platform Comparable), and Conv. value / cost (Platform Comparable) answer different follow-up questions than the headline conversion count. A deck that shows only one column without the cost column invites misread efficiency.
A lower CPA means nothing if the counting rules were not aligned first.
Google documents two adjustments behind platform-comparable conversions. Understanding them prevents mistaking the column for magic parity.
Google's illustrative example in the documentation shows how excluding view-through conversions can understate performance versus platforms that include them in reporting models. The platform-comparable column closes part of that gap for Demand Gen only. It does not remove every creative, audience, or auction difference between platforms.
Waterfall credit among Demand Gen touchpoints follows last Demand Gen click, then last engaged view, then last view. When multiple Demand Gen campaigns appear in a path, the last interaction receives full credit under the isolation rules. Campaign-level reporting can therefore differ from ad-level intuition. The proof note should name the reporting level used in the comparison.
Directional reads still help when absolute parity is impossible. Google's best-practice note says to check whether the delta across core KPIs is positive or negative for directional impact rather than pretending one column settles every budget fight. Directional language belongs in the deck title, not buried in speaker notes.
When primary and platform-comparable columns barely diverge, say so. That outcome is useful proof that Demand Gen already owned last-touch credit in the window you exported.
What platform-comparable reporting changes versus primary conversions.
| Dimension | Primary conversions | Platform Comparable |
|---|---|---|
| Google portfolio credit | Credit can share across Search, Shopping, Display, Demand Gen | Credit limited to Demand Gen touchpoints only |
| View-through conversions | Excluded from default reporting | Included in platform-comparable metrics |
| Optimization use | Used by bidding systems | Reporting only; does not affect bidding |
| Cross-Google comparison | Appropriate for in-account decisions | Not for comparing Demand Gen to Search or PMax |
Google's comparison guidance lists structure parity before column selection. Skipping setup parity makes platform-comparable columns decorative.
Align conversion events and attribution windows across platforms first. Google's documentation recommends the same lookback for conversion and reporting views. Match budgets to platform best practices: Google's example cites roughly $100 to $500 per ad group for Demand Gen and similar spend multiples elsewhere. Align bid strategy intent, audiences, and creative quantity where feasible.
Only then pull conversions (Platform Comparable), Cost / conv. (Platform Comparable), Conv. rate (Platform Comparable), and Conv. value / cost (Platform Comparable) beside the other platform's columns with the same date range.
Screenshot exports without column definitions fail the proof test at finance review. The export should list column name, date range, conversion action set, and whether view-through conversions are included. That footnote is part of the metric, not optional commentary.
- Name the stakeholder question before choosing primary or platform-comparable columns.
- Keep primary conversions visible for bidding and in-account optimization reviews.
- Document conversion event, window, budget, audience, and creative parity assumptions.
- Attach caveat language before the metric enters a client or finance dashboard.
Structure parity is the part of cross-platform proof most decks skip.
Platform-comparable conversions support constrained cross-platform reporting when setup parity and caveats are documented. Primary conversions support bidding, business quality review, and in-account Google comparisons. Hold the report when the metric role or caveat language is unclear.
Use platform-comparable when
- The question is how Demand Gen compares to a non-Google platform under documented setup parity.
- Caveat language about isolation, view-through inclusion, and reporting-only scope is attached.
- Related columns such as Cost / conv. (Platform Comparable) are pulled with the same window.
Use primary conversions when
- The decision is bidding, budget optimization, or comparing Demand Gen to Search or Performance Max.
- GA4 or Floodlight conversions are the main actions and AWCT support is unclear.
- Historical platform-comparable data does not cover the period in the deck.
Platform-comparable reporting is a documentation job Parallel AI handles well on connected Demand Gen accounts. The agent pulls primary and platform-comparable columns, notes where they diverge, drafts the caveat block finance and clients need, and writes the comparison in a doc or spreadsheet before anyone presents blended averages. It does not replace Google's reporting surfaces. It makes the proof roles legible. Decks without caveat footnotes become budget decisions without evidence. See for upper-funnel proof beyond conversion columns. On Monday morning, open the Demand Gen campaigns in the cross-channel review, write one sentence per metric role (primary versus platform-comparable), and paste the caveat block into the deck before finance sees the numbers.
Google documentation
Google's reference for platform-comparable conversion reporting.
Google's Demand Gen reference for campaign and reporting context.
- Attributed Branded Searches in Demand Gen: How to Use the MetricFor teams where brand search lift looks compelling but downstream proof is not ready yet.
- Demand Gen for B2B and Ecommerce: Diagnose Quality Beyond CTRHelpful when CTR looks strong but B2B pipeline or ecommerce ROAS tells a different story.
- Cross-Channel Bid Optimization: Review Budget Moves Before You ReallocateFor teams about to reallocate Google Ads budget when channel ROAS rows use different counting rules.